
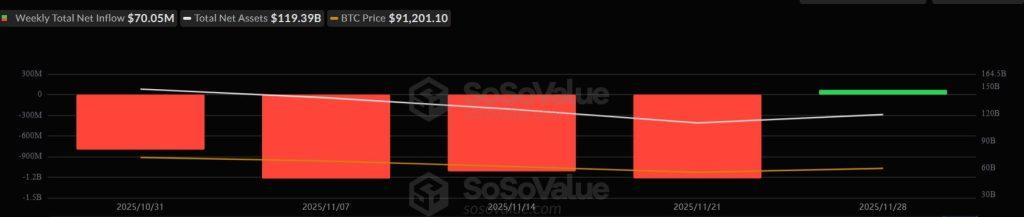
US-listed Bitcoin ETFs capped their second-heaviest month of redemptions with a rare late-month shift back into positive flows.
According to SoSo Value data, the 12 US-listed spot Bitcoin funds recorded net creation of roughly $70 million in the final days of November, after four weeks of relentless selling pressure that totalled more than $4.3 billion in net outflows.
Despite the modest nominal reversal, the timing of this brief respite from outflows suggests a critical exhaustion of seller momentum.
Considering this, the market enters December in a fragile equilibrium, caught between a constructive supply shock and a disjointed macroeconomic calendar that threatens to leave policymakers and traders flying blind.
Bitcoin ETFs and their poor November
November served as an actual structural stress test for the mature ETF complex, confirming what the market has long believed: these products are now the unequivocal price-setters for the asset class.
Last month, Bitcoin ETFs recorded $3.48 billion in net outflows, the deepest negative print since February.
The composition of the exit suggests a broad-based tactical retreat rather than a fundamental capitulation.
BlackRock’s IBIT, which is typically the sector’s liquidity vacuum, led the outflows, shedding $2.34 billion. This marks a significant rotation for a fund that has dominated inflows for most of the year.
Fidelity’s FBTC saw $412.5 million in redemptions, while Grayscale’s GBTC continued its slow bleed with $333 million in outflows. Ark Invest’s ARKB and VanEck’s HODL also saw capital flight, recording exits of $205.8 million and $121.9 million, respectively.
Yet, the bearish impulse revealed a silver lining regarding market depth.
Despite a nearly $3.5 billion monthly exit, Bitcoin price action defended the mid-$80,000s, refusing to break market structure to the downside. This resilience implies that while tactical capital retreated to lock in year-to-date gains, underlying demand remained sticky.
Still, the cumulative net inflows for spot Bitcoin ETFs since January 2024 sit at a robust $57.71 billion, and the funds collectively hold approximately $120 billion in assets.
The multiplier effect
The significance of the late-November stabilization is best understood through the mechanics of network issuance, which gives ETFs outsized leverage in price discovery.
Following the 2024 Bitcoin halving, the network’s block subsidy dropped to 3.125 BTC per block, capping daily coin issuance at roughly 450.
At current valuations, this equates to roughly $38 million to $40 million in daily new sell pressure from miners. In this supply-constrained environment, even a “trickle” of ETF inflows can act as a powerful lever.
So, net creations in the $50 million to $100 million daily range are sufficient to absorb the entire daily issuance multiple times over. This means that when flows turn positive, market makers are forced to bid up spot inventory to satisfy creation units, as there is no structural surplus of new coins to dampen the demand.
Conversely, this leverage works against the price during periods of liquidation. The sustained $100 million-plus daily outflows seen throughout November forced issuers to return Bitcoin to the market, requiring liquidity providers to absorb not only the 450 new coins minted daily but also thousands of coins from unwinding ETF baskets.
If the $70 million net inflow seen last week continues, the supply-demand dynamics shift back in favor of price support, removing the artificial supply overhang that defined November.
December’s macro visibility gap
While the internal market structure appears to be healing, the external macro environment presents a unique risk for December.
Bitcoin investors are preparing for an unusual disconnect in the economic calendar as the Federal Reserve’s Federal Open Market Committee (FOMC) meets on Dec. 9–10.
Still, the next Consumer Price Index (CPI) reading will not be released until Dec. 18, following the shutdown-related cancellation of October’s data collection.
This sequence creates a “blind flight” scenario. The Federal Reserve will be forced to set the tone for interest rates and update its economic projections without the most critical data point markets use to anchor inflation expectations.
This is a dangerous ambiguity for Bitcoin, which remains highly correlated to global liquidity conditions and real rates.
Market participants will be forced to extrapolate policy intent from guidance rather than hard numbers. A hawkish tilt from Chair Jerome Powell could rapidly tighten financial conditions, especially if it is delivered without the counter-narrative of inflation data.
In a scenario where the Fed signals “higher for longer” to hedge against the missing data, the conditions that drove November’s drawdown could quickly re-emerge, punishing risk assets before the CPI print can validate or refute the central bank’s stance.
Meanwhile, the macro disconnect is further complicated by seasonality.
December liquidity typically thins significantly as hedge funds and institutional desks lock in annual performance and reduce gross exposure heading into the holiday season. In a thin market, order books become shallower, meaning smaller flow numbers can trigger outsized price moves.
Bitcoin ETFs flow equation
Considering the above, market participants are increasingly framing December through flow bands rather than directional price targets, reflecting how tightly ETF activity now anchors Bitcoin’s trading range.
If net creations hold in the $50 million to $100 million band, the complex would absorb roughly 11,500 BTC for every $1 billion in inflows at an $86,800 reference price, equivalent to 25 to 50 times daily issuance.
| Flow Band (Daily Net Flows) | Monthly Impact | BTC Absorption (per $1B inflows at $86,800/BTC) | Issuance Multiple | Market Implication |
|---|---|---|---|---|
| +$150M to +$200M | +$3B to +$4B | ~11,500 BTC per $1B | 25x–50x | Strong upward pressure; liquidity tightens across venues |
| +$50M to +$100M | +$1B to +$2B | ~11,500 BTC per $1B | 25x–50x | Structural support; ETFs absorb multiples of daily issuance |
| –$50M to –$150M | –$1B to –$3B | N/A (net selling) | N/A | Recreates November’s dynamic; market makers forced to source BTC; elevated volatility |
| 0 to +$50M | Flat to +$1B | Modest absorption | Slightly > issuance | Neutral to mildly supportive; stability depends on macro tone |
| Below –$150M | Worse than –$3B | N/A | N/A | Severe liquidity stress; accelerates downside in thin year-end markets |
However, a move back into outflows within the $50 million to $150 million zone would recreate November’s pressure, but in a market contending with even thinner year-end liquidity.
In that setting, policy uncertainty and reduced market depth tend to amplify volatility, leaving ETF flows as the dominant force shaping Bitcoin’s direction into the new year.
The post Bitcoin ETFs end brutal November with a late $70M inflow appeared first on CryptoSlate.